How will Newcastle United perform in the 24/25 season?
Following an uneven season caused by long-term injuries and fatigue, what can advanced data tell us about how Newcastle United stacks up going into the 24/25 season?
But separating the things that matter from those that don’t. Separating the fact from opinion, the cool logic from emotion following a win or loss isn’t always easy – especially when you aren’t privy to behind-the-scenes information.
Instead as onlookers, we fill the knowledge void based on our own experiences with football. A resulting cognitive bias known as the Dunning–Kruger effect takes place across Twitter, podcasts and virtual pages as a mix of hot takes, trolls, joy, anger, indifference and more nuanced opinions vie for supremacy.
Within this virtual shouting match, the narratives that follow the team take root, take on a life of their own and eventually need to be addressed by the media and by extension the manager. And boy did the 23/24 season keep the masses fed, just off of the top of my head we had: “Guimaraes should be dropped”, “Newcastle can’t pay away” – both hangovers from the end of the 22/23 season – “Howe’s waits too long to make subs”, “Nick Pope’s kicking is holding us back”, “we’re mint and going to go far in Europe”, “Howe’s lost the dressing room”, “the medical team don’t know what they’re doing”, “AC Milan knew all along about Tonali”, “Injuries & fatigue are killing us” I could go on and on and on anddddd on. None of us are immune to it. We all play our part.
In my experience, keeping a close eye on the team’s performance data helps cut through the hype and negativity, to bring even an obsessive fan like me back to earth, to something closer to object truth beyond the histrionics.
So where to start? Well while past performance isn’t a foolproof way to predict the future – especially following an off-season with a relative amount of upheaval behind the scenes – there are lessons to be learned from Newcastle United’s uneven performances in 23/24.
The league table doesn’t lie?
Before we look at Newcastle United’s underlying metrics and more advanced data, let’s remind ourselves of our final position in the league last season.
Howe’s men finished just 8pts off of the UCL spots, 11pts worse off than the 22/23 season, broke Newcastle United’s goalscoring record and conceded 29 more goals than 22/23.
When you look at the results in date order, it’s perhaps understandable how so many competing narratives took hold. In an industry famous for its whiplash nature of only being as good as your last result figuring out where the 23/24 version of Howe’s team stacked up was less than straightforward.
The worst injury record in the Premier League, is context, not an excuse…
The only thing that felt consistent last season, was the number of players Newcastle United had unavailable to play each week. It started with Joe Willock’s hangover from the previous season and Matt Targett‘s torn hamstring and didn’t ease at any point.
It was 41 separate injuries and 1,950 days of player unavailability, which doesn’t even include Tonali’s ban. While I don’t want to relitigate the cause of the injuries because all views on this have some merit – playstyle, schedule, increased load of remaining players, players determined not to miss the Euros, the need to get players back, etc – we also shouldn’t forget the same team behind the scenes managed to keep an ageing defence fit for the entire 22/23 season.
Where you sit on this spectrum of the cause of these injuries, I don’t think it’s a stretch to call a season where you suffer two ACLs, two dislocated shoulders, two lower stress back fractures, an Achilles infection morphs into a season-long absence, a weird Turf-Toe ligament injury and a gambling ban anything other than unlucky. It denied Howe the use of £100m+ worth of transfer additions for most of the season, meaning that the results delivered by a squad that going into 23/24 most Newcastle fans would say “wasn’t good enough” had to suffer.
This is context, not an excuse. There’s a difference.
What does the underlying data tell us?
So keeping all of that in mind, what can Newcastle’s EPL data from such a disrupted and difficult data tell us about what’s next? Well, for me the signs are pretty encouraging.
When you look at our 10-game rolling xG for and conceded from the end of the 22/23 and across to the 23/24 season we see a generally decent start to the new season, followed by a defensive crisis, before a recovery towards the end of the campaign.
That two months when fatigue and injuries reduced Newcastle’s ability to defend transitions to nil was brutal – barring that one home win vs. Fulham against 10 men – it was probably the worst stretch of games that Howe’s team had played following his arrival as manager. The zenith of this was on New Year’s Day at Anfield, which hung like a millstone around the team’s metrics until it finally dropped off the rolling averages in April.
Why does any data that isn’t the score matter? Well if you track xG difference to actual goal difference, the correlation – though rarely perfect – is pretty clear to see.
If we accept that we can learn something beyond the swings of luck using these underlying metrics, then we potentially get a bead on what’s next. After all, xG comes from the gambling industry’s desire to predict the game better.
So when you analyse these trendlines against the context of the injuries, schedule and results you end up with three distinct phases across the season:
August to the end of November: Despite the injuries and the busy schedule, the team were fresh enough to grind out results.
December to end of January: Injuries to key players (most notably Pope) cumulative fatigue and an unrelenting schedule made Howe’s game model impossible.
February to the end of the season: A break in January, some players returning and easing schedule see the team start to refind their levels.
By comparing Newcastle’s to the league average for these metrics (& more) and showing where they’re performing relative to the rest of the league across these phases, I think we’ll get some clues about what this season might look like.
August to the end of November
The start of the season was a real mixed bag. The amazing home win vs. Villa was followed up with limp performances at City and Brighton, a very annoying game vs. Liverpool where Darwin Nunez turned into prime Ronaldo for two shots and a 7-game unbeaten run. This part of the season ended with wins against Arsenal, a sign of things to come at Bournemouth and a 4-1 win against Chelsea.
Attacking Radar 🔴 vs. League average 🔵
Defensive Radar 🔴 vs. League average 🔵
As you can see, Newcastle was in pretty good shape across this period, especially in attack – though I’d like more shot volume. The lack of pace in the backline still left us a little vulnerable to counters, but generally, we were keeping teams to around 1 xG against per 90. Pretty solid.
When you look at the xG for and against the rest of the league during this period, things were pretty healthy and Howe’s team were firmly in the best of the rest after Arsenal and Man City.
December to end of January:
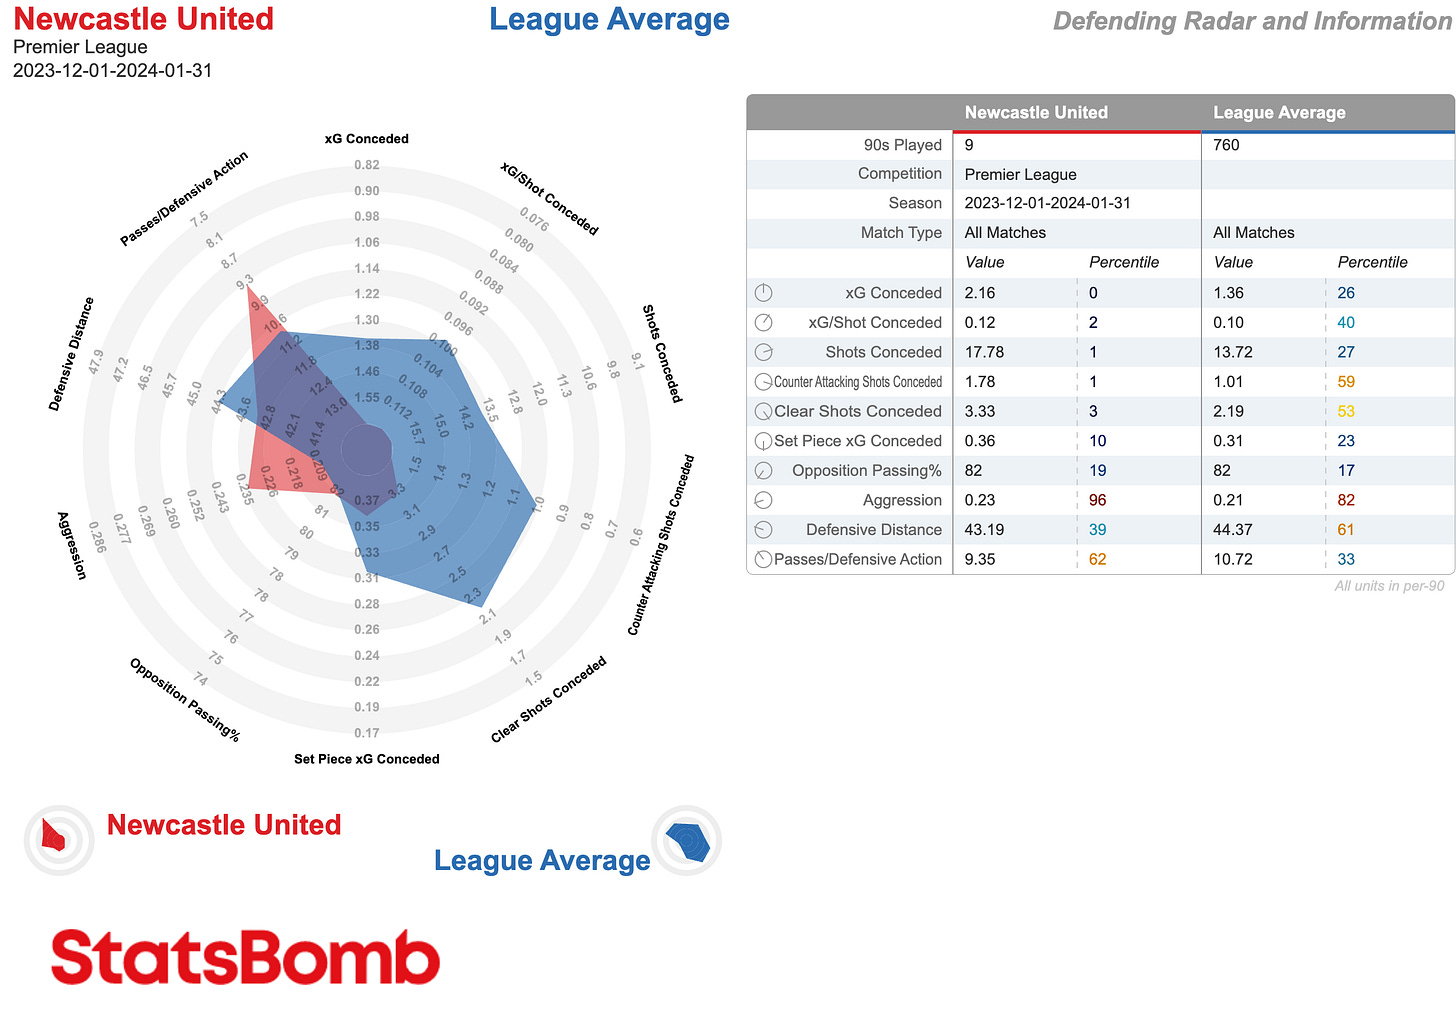
When we repeat the exercise for a bunch of results that are entirely too depressing to list in the same manner, we see just how sharply the collective effects of injuries/fatigue caused the wheels to come off the season.
Attacking Radar 🔴 vs. League average 🔵
Defensive Radar 🔴 vs. League average 🔵
The complete collapse of our physical ability to press the ball, make recovery runs and maintain shape when teams moved us from side to side, was evident in every minute. Interestingly, our attacking numbers remained solid and our shot volume increased, as Howe attempted to kill games early.
Coupled with the frankly concerning performances of Martin Dubravka during this period and across the rest of the season, I maintain that no matter what Howe did during this period, he didn’t have enough fit horses to materially change results in this period.
February - end of season
After a January window came and went without additions (for the PSR reasons we saw this summer) the team started to get some bodies back, players managed to get a little rest between games and while line-ups were not consistent we started to see more of players like Hall, Livramento, Lascelles, Krafth and Murphy who had played fewer minutes and were a little fresher. Things first stabilised, then improved, as a magnificent performance at Villa Park was somewhat marred by performances away to Man Utd and Chelsea. Again Dubravka’s wildly variable play put a team regaining its confidence under pressure at key moments in games.
Attacking Radar 🔴 vs. League average 🔵
Defensive Radar 🔴 vs. League average 🔵
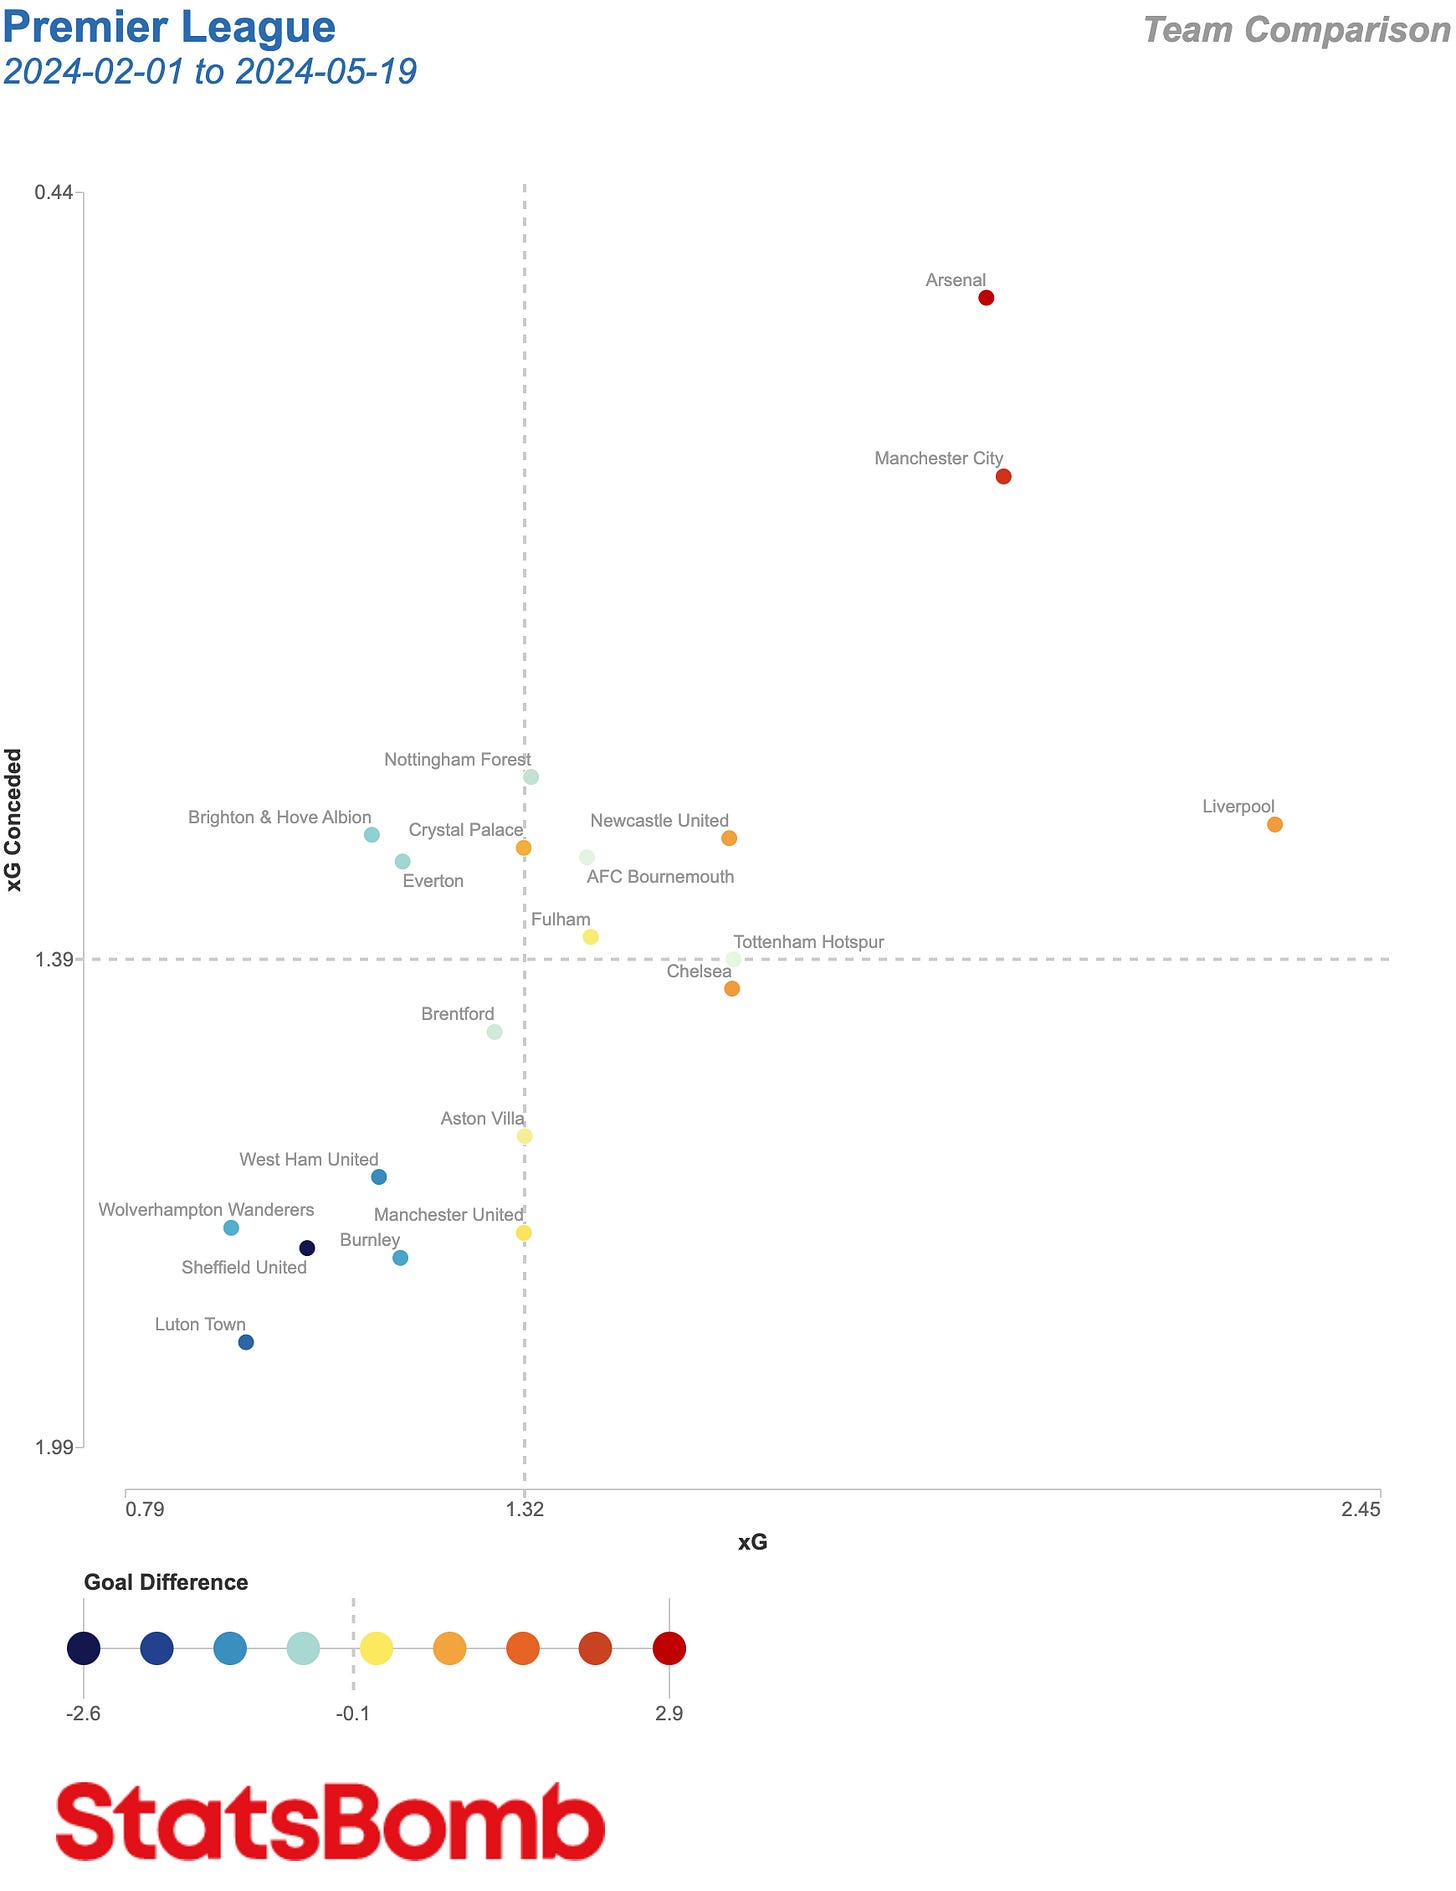
Though not as healthy as in the first third of the season, Newcastle’s defensive recovery from what must have been a real deterioration in confidence levels during the Christmas-period collapse is low-key impressive. Again in attack, we’re seeing consistently high performance levels to end the season. It’s a credit to Howe and his staff that in most years it’d have been good enough for European football *shakes fist at Pep’s City*.
When we compare this to the wider league, we again find Newcastle United in the best of the rest territory.
Conclusions
So what does this tell us? Well generally, when not decimated by injuries Eddie Howe’s Newcastle United team has strong and broadly consistent underlying data.
While xG isn’t the be-all and end-all of team performance, it does tell us that with a fair wind, we should be in the mix for the European and Champions League spots again. Even in a year where everything that could go wrong, WENT WRONG, the floor of a squad that was missing so many key players for so long only missed out on Europe based on an unexpected cup final result.
With the addition of some pace to the back line in Lloyd Kelly (read my analysis here) depth at striker via William Osula, (read my analysis here) and perhaps the addition of Marc Guehi and possibly a yet-to-be-named new right winger too, it feels like we’ve seen enough from Howe to suggest that Newcastle that – so long as the attacking output remains consistent – that any improvement in defensive performance will leave us well positioned to take advantage if any of the big-6 (& Villa) fail to meet the levels required.
If you pushed me for a prediction today, with just a little more luck based on last season I’d say 4th-6th feels more than achievable and might be expected from an ownership and fanbase that expects more and more with each passing season.
Fingers crossed and HWTL 🙌


Great post! This lines up with my preseason model predictions, I've got 4th spot very close: Chelsea 61 points, Tottenham 61 Points, Newcastle 60 points.
Fantastic, Kev!